Our Final Project

Image


After many hours of revision, Bintou and I have finalized our website. We changed the layout a bit from when we presented, added a bit more info, and provided some links to external websites with additional information. We also had to re-do our map as our trial subscription to ESRI ran out! 

Here is our final website!


Exploring Ancient Rome: Review of Brenden’s Project!

For his final project, Brenden decided to recreate the most notable buildings of ancient Rome! It was instantly obvious that this was a fantastic idea for a digital humanities project – what better way to understand an ancient city than being able to see it in a realistic 3D program?!

The software he chose to use was Google Earth. This decision was made based on the ability to upload KMZ files that were configured to their correct geographic locations using the Google Sketch Up application. Being able to upload 3D recreations of buildings into Google Earth was a completely new concept to me, and I was impressed with Brenden’s skill in doing so. During his presentation he showed us what it looked like to upload an arch into Google Maps and explore what it would have looked like in its historical location.

The only downfall of this method is that it is not possible to embed the completed Google Earth city onto a website for easy viewing. Instead, you must download Google Earth, download the individual KMZ files, then upload them in Google Earth to view them. Although this is a bit of a hassle, it was worth it. Unfortunately it is not very effective to have all of the buildings open at once as this takes a long time to load so exploring each building individually is the best bet.

To compliment this, Brenden created a website using Wix online software where he provided an explanation of each building he provided KMZ files for. He gave an introduction to the context of the project, had different sections describing the different types of architecture, and finally a dropbox containing the KMZ files available for download. This was very effective as it made it possible to give a historical background on each of the buildings for educational purposes as was the goal of his website – to make it useful for education, primarily elementary or high school level.

Here is the link to his website.

Some of the problems he outlined was the extremely slow loading time, making it a huge time commitment to work on the project, as well as the fact that Google Earth doesn’t cooperate well with laptops but is a bit better on a desktop computer. Another problem was that Google Earth uses modern ground elevation that are different from the time in which the buildings stood – this left the model sitting too high or below the modern street view level.

Overall, I thoroughly enjoyed exploring Brenden’s project! It is a great contribution to the digital humanities discipline, and I believe it would be beneficial to elementary or high school students hoping to learn about and explore ancient Rome!


Final Site!

We did it!

bbarrow2013: Digital Humanities

FINALLY!!! After all the word work our site is finally done. After taking into consideration all the comments we got from our peers as well as Professor Ross, I believe the final site is looking better than what we initially showed the class during our presentation. Creating a website is no joke, but I can definitely say working with a partner was worth it. Enjoy. http://cfinamor.wix.com/coastalbcaboriginals

View original post


Project Update

As the week has progressed, Bintou and I have come quite far in organizing our project. We have made some important decisions on how we are going to complete the task we have set out for ourselves.

We want to explore the First Nations of British Columbia and their migration patterns within regions. We hope to uncover the trends of movement between rural and urban populations over time and determine possible reasons for the trends. Another area that will be interesting to explore is movement on and off of reserves. Some possible motivators for migration may include opportunities for employment or education, among many others.

Our plan is to create an interactive map tracking this movement during a certain time period by geographical region. Ideally we would show the migration trends through the years, accompanied by a text component explaining the possible motivators and reasons for the migration. If we are able to divide the data by age and gender that would help to make the map easier to understand and the data easier to interpret.

We have found that it is possible to obtain BC census data for the years 1996, 2001, and 2006 in a format already input into Microsoft Excel. The files are uploaded by category, some of which include education, labour supply, unemployment, and factors influencing well-bring – all of which are possible motivators for migration. After realizing that this data is easily obtainable, we were left to the task of deciding how to adequately display this information in a way that allows us and others to analyze the associated trends.

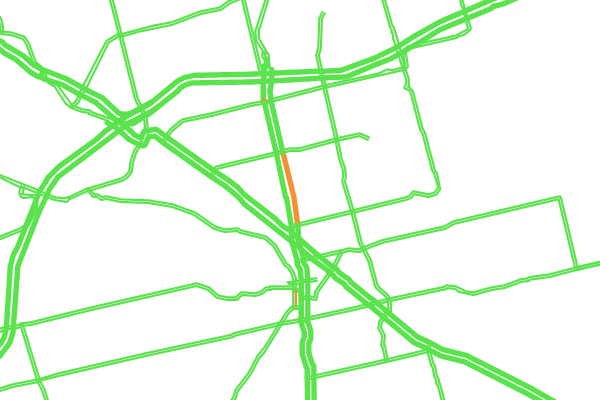
There are a multitude of programs available, both web-based and downloadable to your computer, that allow the creation of interactive maps that are excellent for educational purposes. The hard part is choosing one that does all that we need it to, and that is easy enough to understand and use for beginners on the subject like us! The type of map that keeps jumping out at us is a choropleth map. This is typically used to show population density by region, but can also be used to show levels of employment, school enrollment  or other quality of life indicators. It uses a coloured scale to demonstrate density and is therefore easily comparable between regions. Different maps can be compared to show changes over time, so we could have a map for each year of census data – 1996, 2001, and 2006 – for a total of 3 maps. We would need to make one for each indicator we want to display… Meaning one for population density, one for unemployment, etc. 

Although this is not the way we originally wanted to format the project, we believe this will be the best way to display the data we are wanting to include. We had hoped to do an interactive map that actually displayed the migratory trends from place to place, but realized that obtaining data would be next to impossible. We would need to get the start and end points for everyone who moved during the time period, compile all of the data, and figure out how on earth to display it all. By doing it by population density per region, and making a series of maps to compare over time, we are not able to explore movement of specific people but rather overall trends in the general First Nations population of British Columbia. We believe that for our purposes this is a sufficient task to pursue.

One problem we have run into, however, is that some of the census data goes by percentage of the population living either on or off reserve, or percentage unemployed by region, rather than an actual number of people. I am not sure how the programs will handle this format of information, or if we will have to do further research into the total population of each region to be able to translate that to a hard count. This is only a minor setback as it is possible to manipulate the present data to resolve the issue, it will just require a bit more brain power.

We are still trying to decide between a couple of programs to create our map with. Ideally we would be able to either save the map to our computer and then upload it to our website, or embed a map from a web-based program directly onto our website. We hopefully be using our UoG webspace for this project so that we can display both the map and our textual research component!

If anyone has suggestions for mapping programs or website design we are opened to suggestions (and frankly I think we need some)!


A Review of Nick’s Project!

For his final project, Nick has decided to make a website with information about the 12 Squadron RAF unit during WWII. He has personal interest in this project as his grandfather served in the squadron. I think it is great to have a connection to the research you are conducting as it makes it more enjoyable and rewarding, as well as providing a source of motivation to work towards the full potential of the project!

Nick seems to be doing a very good job of overcoming the obstacles he has encountered so far. There is a lack of existing material on 12 Squadron available, making his research process strenuous. He has been using RACER to obtain books from a variety of libraries which will hopefully prove valuable to his research. He has also found a few links to YouTube videos from which he can obtain personal accounts and firsthand stories to add to his website. One idea Nick may consider is a section on his website where some of these videos can be embedded and watched by the site’s visitors. I am not sure if he would need to gain certain permissions to do so, but I think it would add a lot to the overall atmosphere of his website.

When it comes to the debate between making a database of information that is searchable by family name, etc… I think that he would need to be very dedicated to the idea if he was to decide to do so. It would take a lot of time spent doing uneventful data input. However, if he is willing to commit to the effort I’m sure the outcome would be fantastic. The database could be used to find information about family members who participated in 12 Squadron and learn about their personal experiences during WWII.

If the project goes no further than an educational website I think it is still a fantastic idea. Perhaps it will be possible to make a section profiling a few specific people if it is possible to gain enough information. It could feature a short background story then highlight their experiences during WWII, with pictures if possible. Another thought it to search primary source databases for letters or correspondences written between soldiers and their families. This would add to the personal feel of the website, and as I gathered from Nick’s presentation this seemed like a route he would like to pursue! 


Assignment #4

Image

Using Public Data to Provide Analysis – INRIX Traffic

INRIX is a downloadable smartphone application that collects data from users to contribute to the traffic analysis output. A precise mapping system highlights roads by colour according to the traffic conditions – green is a good drive, yellow is slow, red is stopped traffic, etc. It updates approximately once a minute to keep the information moving in real time with traffic. Users of the application can contribute by reporting inaccuracies or accidents as they happen. Everyone who uses the app is a contributor via crowd-sourcing – by having the application open on your smartphone you are anonymously sending speed datapoints to the INRIX server, which combines data from all users to produce the most accurate traffic report possible. The more people using the application, the more precise the data. INRIX is available in 20 countries, on all types of smartphones.

Here is the website’s page with information on crowd-sourcing: http://www.inrixtraffic.com/blog/2012/magic-how-inrix-traffic-crowd-sourcing-really-works/ 


Assignment #3

Image

Satellite Archaeology

Digital technology is helping archaeologists take discovery to a whole new level. Satellites perched approximately 400 miles above earth are being used to collect images of possible archaeological sites that are hidden underneath the surface layer of earth. With the correct combination and processing of images, archaeologists can detect inconsistencies on the surface that are caused by the remains of structures, roads, and rivers covered by a foot or less of earth cover. They are then able to map out ancient cities, etc. with amazing precision prior to excavating the area.

Here is the National Geographic article from which I am sourcing this information: http://ngm.nationalgeographic.com/2013/02/explore/satellite-archaeology

A university of Alabama archaeologist Sarah Parcak has been using the technology to scan the landscape of Egypt. In 2011 alone, along with her team Parcak uncovered as many as 17 possibly buried pyramids, about 3000 settlements, and close to 1000 tombs across the country. Discovery at that scale would have taken years, probably even centuries, longer without this technology. The ways in which this is useful to the humanities are countless. It is literally a method of glimpsing directly into the past of a place – saving us the wait of being on the ground excavating in order to map out a city.

Having it all laid out virtually, at your finger tips, makes it possible to understand a civilization further than ever before. It will save scholars time and money on lengthy searches for sites, and instead they can skip right to the excavation process – allowing us to uncover more about the past at a faster rate. As a student, such technology will make the information accessible to me. Rather than going to the site and exploring, which is clearly not always possible, there is a digital version available for exploration. Students in classes around the world can view the maps of ancient cities and gain the best understanding of the process of archaeological discovery and exploration.


Assignment #2

My Experience with ORLANDO

My first impression is that this is a very useful research tool. I like the idea of having a wide variety of authors over a vast time period all accessible through one search, while remaining within the topic. Being able to go from a general search with multiple pages of results to a more specific search with a single page of results is a definite asset – and having the case studies as example of how to do this was helpful. I would use ORLANDO in the preliminary stages of my research as it would be beneficial to gathering examples of instances supporting my topic. By this I mean if I was conducting research on the way women used literature to gain an income in the early 1900s, ORLANDO would supply me with an array of women into whom I could search further to form my body of research, using other sources that perhaps do not make the search so easy to turn up narrow results. A database using keyword searching such as ORLANDO is an invaluable tool for researchers in the humanities.


Brian Sandberg: Historical Perspectives

The academies of Renaissance Italy are being compared with internet social networks, such as Facebook. A major collaborative research project on The Italian Academies 1525-1700:The First Intellectual Networks of Early Modern Europe, is producing new findings on the complex world of academies in Renaissance Italy. The researchers have launched a website on Italian Academies to present their findings on social interactions among academy members during the Renaissance.

barbieri-anelante

The team has also created an online Database of Italian Academies at the British Library with information on Renaissance academies and their members. The website for the database claims that: “The British Library holds some of the finest collections outside Italy of publications produced by Italian Academies and their members. Much of this material is catalogued in ways which have not permitted easy access by scholars working on a particular Academy or on Academies in general. The creation of a Themed Collection of…

View original post 107 more words

Continue reading

Assignment #1

Image

“How have my studies at Guelph been affected by digital tools and  approaches, and what future possibilities do I see?” 

When we were asked to think about this question in our first class the majority of us arrived at very similar (if not the same) answers. More and more components of our education occur online. It is no longer possible to be successful in your studies at University of Guelph without regular access to a computer and the internet. Every course has a website where updates, assignments, and grades are posted. Online discussion groups are encouraged, and even a marked component of many courses. Conducting research is crucial to completing assignments – and today research mainly consists of keyword searches in an online database that bring us to relevant sources on our topic. Even searching our library for books on our topic is done by a search on a computer that tells us whether the titles are available or not and their location within the library. If they are not available at our library we have the option of an inter-library loan, where a request is put in digitally to Wilfred Laurier or Waterloo and the hard copy is brought right to our Guelph circulation desk for your use.

Upon thinking deeper into this question, however, I have realized that I let these most obvious ways consume my conclusions, meanwhile overshadowing what are perhaps some of the most important ways my university career has been affected by digital tools. As a student of International Development, digital technology has changed my learning experience in countless ways. Keeping up to date with world news is very important to me, and with online news sources this is easier to do than ever. Access to news from all parts of the world is literally at my fingertips thanks to a portable laptop and wireless internet. I can follow the work of NGOs and other development organizations with the click of a button. This modern reality has enhanced my learning experience in the development discipline more than I ever realized before. I cannot imagine the task of collecting hard copies of newspapers from around the world in order to keep up to date on what is happening within the discipline. Therefore, the answer to the question “how have my studies at Guelph been affected by digital tools and  approaches” is a simple one. They have made it a heck of a lot easier!

As for the possible futures I see… This has a more complex answer. I am still amazed everyday at the technological capacities our generation is developing and I can only imagine what is to come in the future. The world has become so remarkably interconnected thanks to digital technologies, and as a true student of International Development I have high hopes that this is promising for the future of human kind. Greater access to the lives and ideas of others can and should, in my eyes, lead to our greater understanding and acceptance of others and in turn compassion and respect. It is easier than ever to work together, despite distance, and I believe this should result in technological breakthroughs the likes of which we can only speculate.